Output
Introduction
This document describes the output produced by the pipeline. Most of the plots are taken from the MultiQC report, which summarises results at the end of the pipeline.
The directories listed below will be created in the results directory after the pipeline has finished. All paths are relative to the top-level results directory.
Pipeline overview
The pipeline is built using Nextflow and processes data using the following steps:
- Bedtools - Used for modification of BED files
- Picard - Used for aggregation of BAM file metrics
- FastQC - Raw read QC
- MultiQC - Aggregate report describing results and QC from the whole pipeline
- Pipeline information - Report metrics generated during the workflow execution
Bed Filter
For the bed_filter mode, a BED file is generated with the methylation positions filtered based on the BED intervals file from the targeted methylation profile.
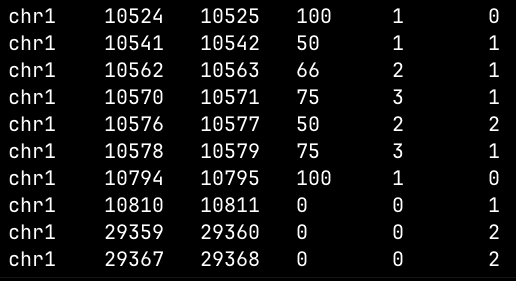
bed_filter mode of target-methylseq-qc.Picard Profiler
Output files
picard/*.CollectHsMetrics.coverage_metrics: a standalone file that contains hybrid-selection metrics for BAM files.*.CollectMultipleMetrics.alignment_summary_metrics: a standalone files containing alignment summary metrics from BAM files.*.CollectMultipleMetrics.base_distribution_by_cycle.pdf: a standalone file exhibiting summary metrics of base distributions as a pdf plot.*.CollectMultipleMetrics.base_distribution_by_cycle_metrics: a standalone file containing base distribution by cycles summary metrics from BAM files.*.CollectMultipleMetrics.insert_size_histogram.pdf: a standalone file exhibiting summary metrics of insert sizes as a pdf plot.*.CollectMultipleMetrics.insert_size_metrics: a standalone file containing metrics on insert sizes from BAM files.*. CollectMultipleMetrics.quality_by_cycle.pdf: a standalone file exhibiting summary metrics of cycle quality as a pdf plot.*.CollectMultipleMetrics.quality_by_cycle_metrics: a standalone file containing metrics on cycle quality from BAM files.*.CollectMultipleMetrics.quality_distribution.pdf: a standalone file exhibiting summary metrics of the quality distribution as a pdf plot.*.CollectMultipleMetrics.quality_distribution_metrics: a standalone file containing metrics on the quality distriburion of BAM files.*.CollectMultipleMetrics.read_length_histogram.pdf: a standalone file exhibiting summary metrics of sample read lengths as a histogram.genome.dict: a standalone file containing a sequence dictionary for a reference sequence.genome.fa: The reference genome FASTA file used to generate the mapping alignmentgenome.fa.fai: The FASTA index file for the reference genome.?
Picard is a set of command line tools that is used for manipulating high-throughput sequencing (HTS) data in formats such as BAM. All results generated through picard related tools come as a standalone file, as well as a matched pdf plot for visualisation purposes.
The output within the picard/ directory correlates to two picard tools, these being CollectHsMetrics and CollectMultipleMetrics.
CollectHsMetrics
The CollectHsMetrics tool collects hybrid-selection (HS) metrics for SAM/BAM files that are specific for sequence datasets generated through hybrid-selection. This tool is most useful for capturing exon-specific sequences for targeted sequencing experiments such as exome sequencing.
CollectMultipleMetrics
The CollectMultipleMetrics tool allows for the running of multiple metric collection tools.
CollectAlignmentSummaryMetricswhich produce metrics detailing the quality of read alignments and the proportion of reads that passed quality filters, these metrics are interpreted as percentages but presented as fractions.CollectBaseDistributionByCyclecharts the nucleotide distribution per cycle in a BAM file, producing a chart to assess any systematic errors at specific read positions. Able to be inferred are miscalled bases through reflections in distribution changes, sequencing errors, and trimming quality, find here Interpretation notesCollectInsertSizeMetricsprovides metrics for validation of library construction, including the distribution of insert size and read orientation of pair ended libraries. Depending on the type of library preparation used these metrics will vary. Output inclues percentages of read pairs in each orientation as a histogram, as well as the insert size distribution as a histogram and txt file.CollectQualityYieldMetricsprovides metrics about reads passing quality thresholds and Illumina-specific filters. The overall quality of the reads within a BAM file are analysed, and output indicates the total number of bases within reads that pass the minimum base quality score and Illumina quality filter thresholds. Included here are the quality by cycle, quality distribution, and read length metric files.
FastQC
Output files
fastqc/*_fastqc.html: FastQC report containing quality metrics.*_fastqc.zip: Zip archive containing the FastQC report, tab-delimited data file and plot images.
FastQC gives general quality metrics about your sequenced reads. It provides information about the quality score distribution across your reads, per base sequence content (%A/T/G/C), adapter contamination and overrepresented sequences. For further reading and documentation see the FastQC help pages.
MultiQC
Output files
multiqc/multiqc_report.html: a standalone HTML file that can be viewed in your web browser.multiqc_data/: directory containing parsed statistics from the different tools used in the pipeline.multiqc_plots/: directory containing static images from the report in various formats.
MultiQC is a visualization tool that generates a single HTML report summarising all samples in your project. Most of the pipeline QC results are visualised in the report and further statistics are available in the report data directory.
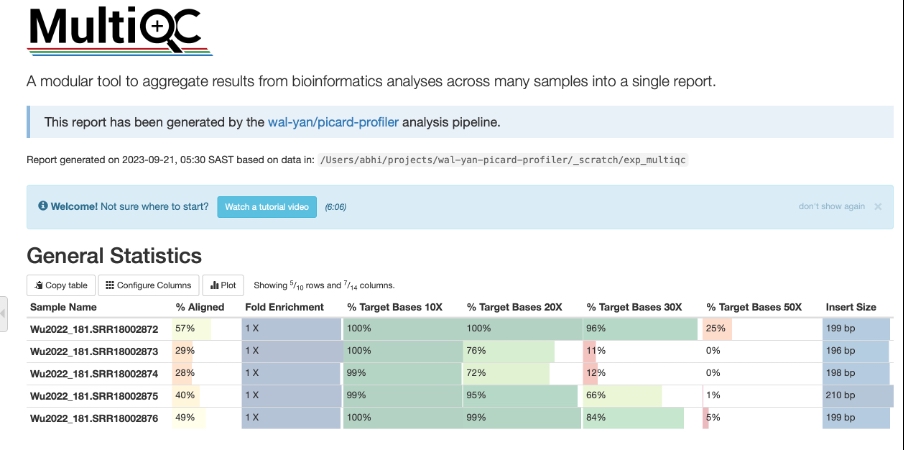
picard-profiler highlighting the refine metrics from targeted sequencing at 10X, 20X, 30X and 50X coverage.Results generated by MultiQC collate pipeline QC from supported tools e.g. FastQC. The pipeline has special steps which also allow the software versions to be reported in the MultiQC output for future traceability. For more information about how to use MultiQC reports, see http://multiqc.info.
Pipeline information
Output files
pipeline_info/- Reports generated by Nextflow:
execution_report.html,execution_timeline.html,execution_trace.txtandpipeline_dag.dot/pipeline_dag.svg. - Reports generated by the pipeline:
pipeline_report.html,pipeline_report.txtandsoftware_versions.yml. Thepipeline_report*files will only be present if the--email/--email_on_failparameter’s are used when running the pipeline. - Reformatted samplesheet files used as input to the pipeline:
samplesheet.valid.csv.
- Reports generated by Nextflow:
Nextflow provides excellent functionality for generating various reports relevant to the running and execution of the pipeline. This will allow you to troubleshoot errors with the running of the pipeline, and also provide you with other information such as launch commands, run times and resource usage.